Build web E2E test system from scratch
TL;DR
The topic of end-to-end (E2E) test is a platitude in web front-end (FE) domain, especially most of blogs are talking about testing frameworks out of the real web production. The real world needs solution, for E2E test which means a service can do E2E testing and alerting with stability and even good performance. This article will introduce how we design and build our E2E test service for the newer version of our web application based on popular web FE frameworks and integration with abundant Microsoft services, including several workarounds to tell the problems we met and how we overcame them.
In addition, I shared this system internally at first, then it becomes my first blog article in English. Probably I will translate it into Chinese sooner or later.
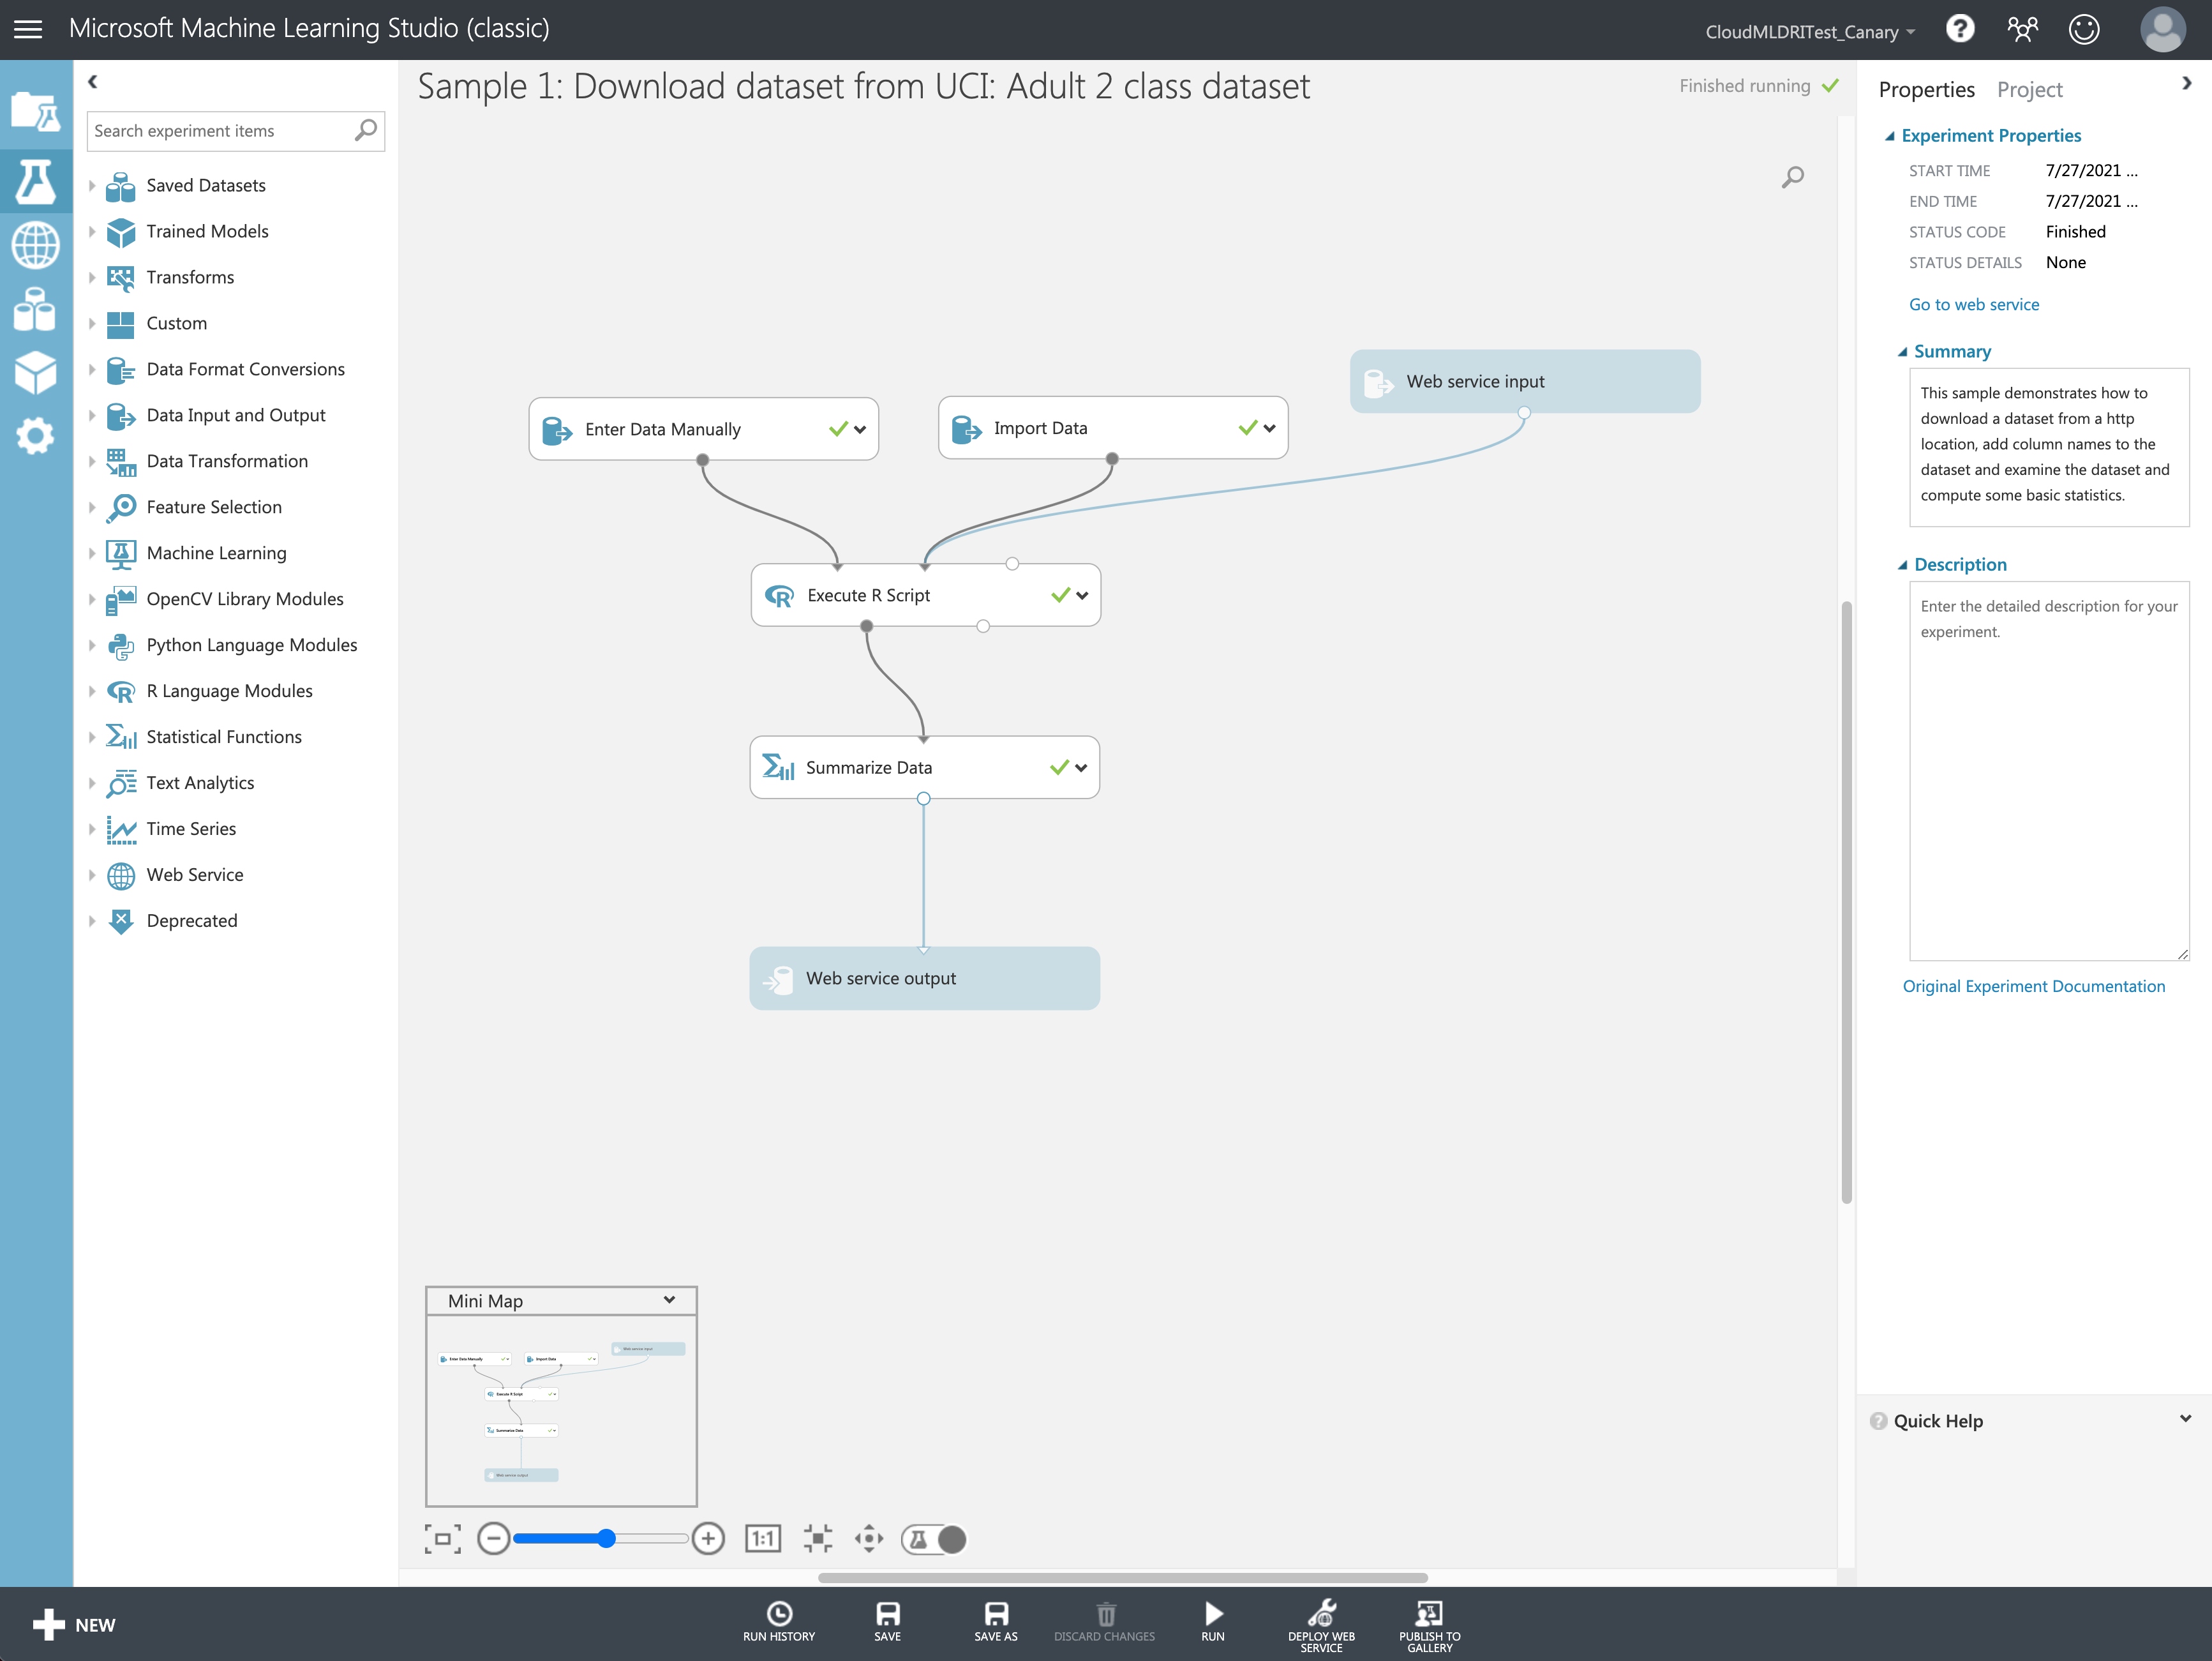
In the July of 2021, we build another E2E system to replace the legacy one for Azure Machine Learning Studio (classic) because its runner service will be decommissioned at once. If you are just interested in the latest things, jump to the chapter for a quick review.
Explorations in 2019
Introduction
“End-to-end testing involves ensuring that the integrated components of an application function as expected. The entire application is tested in a real-world scenario such as communicating with the database, network, hardware and other applications.” Defined by Techopeida.
This topic is a platitude in web FE domain, especially most of online blogs are talking about testing frameworks out of the real web production. When we were facing the task to build E2E test for the newer version of our web application, these questions came across my mind:
How did previous version of our production (V1) do E2E testing?
Can we leverage V1’s work?
If the legacy solution doesn’t meet our requirement and we need to build another one from scratch…
- Which FE test framework is the best for us?
- How can we run E2E test as service with stability?
- How to associate our test data with internal alerting service?
As you can see, there are bunch of questions for us to figure out. It costed two teammates’ and my 2 weeks full-time work and another 2 months part-time work (about 1 day per week) of mine to deliver the first acceptable version, though test service had been online after first two weeks work with some workarounds.
The following parts will cover the answers for questions above, several workarounds we made, and an use case to help our team achieve more 😊.
Legacy solution
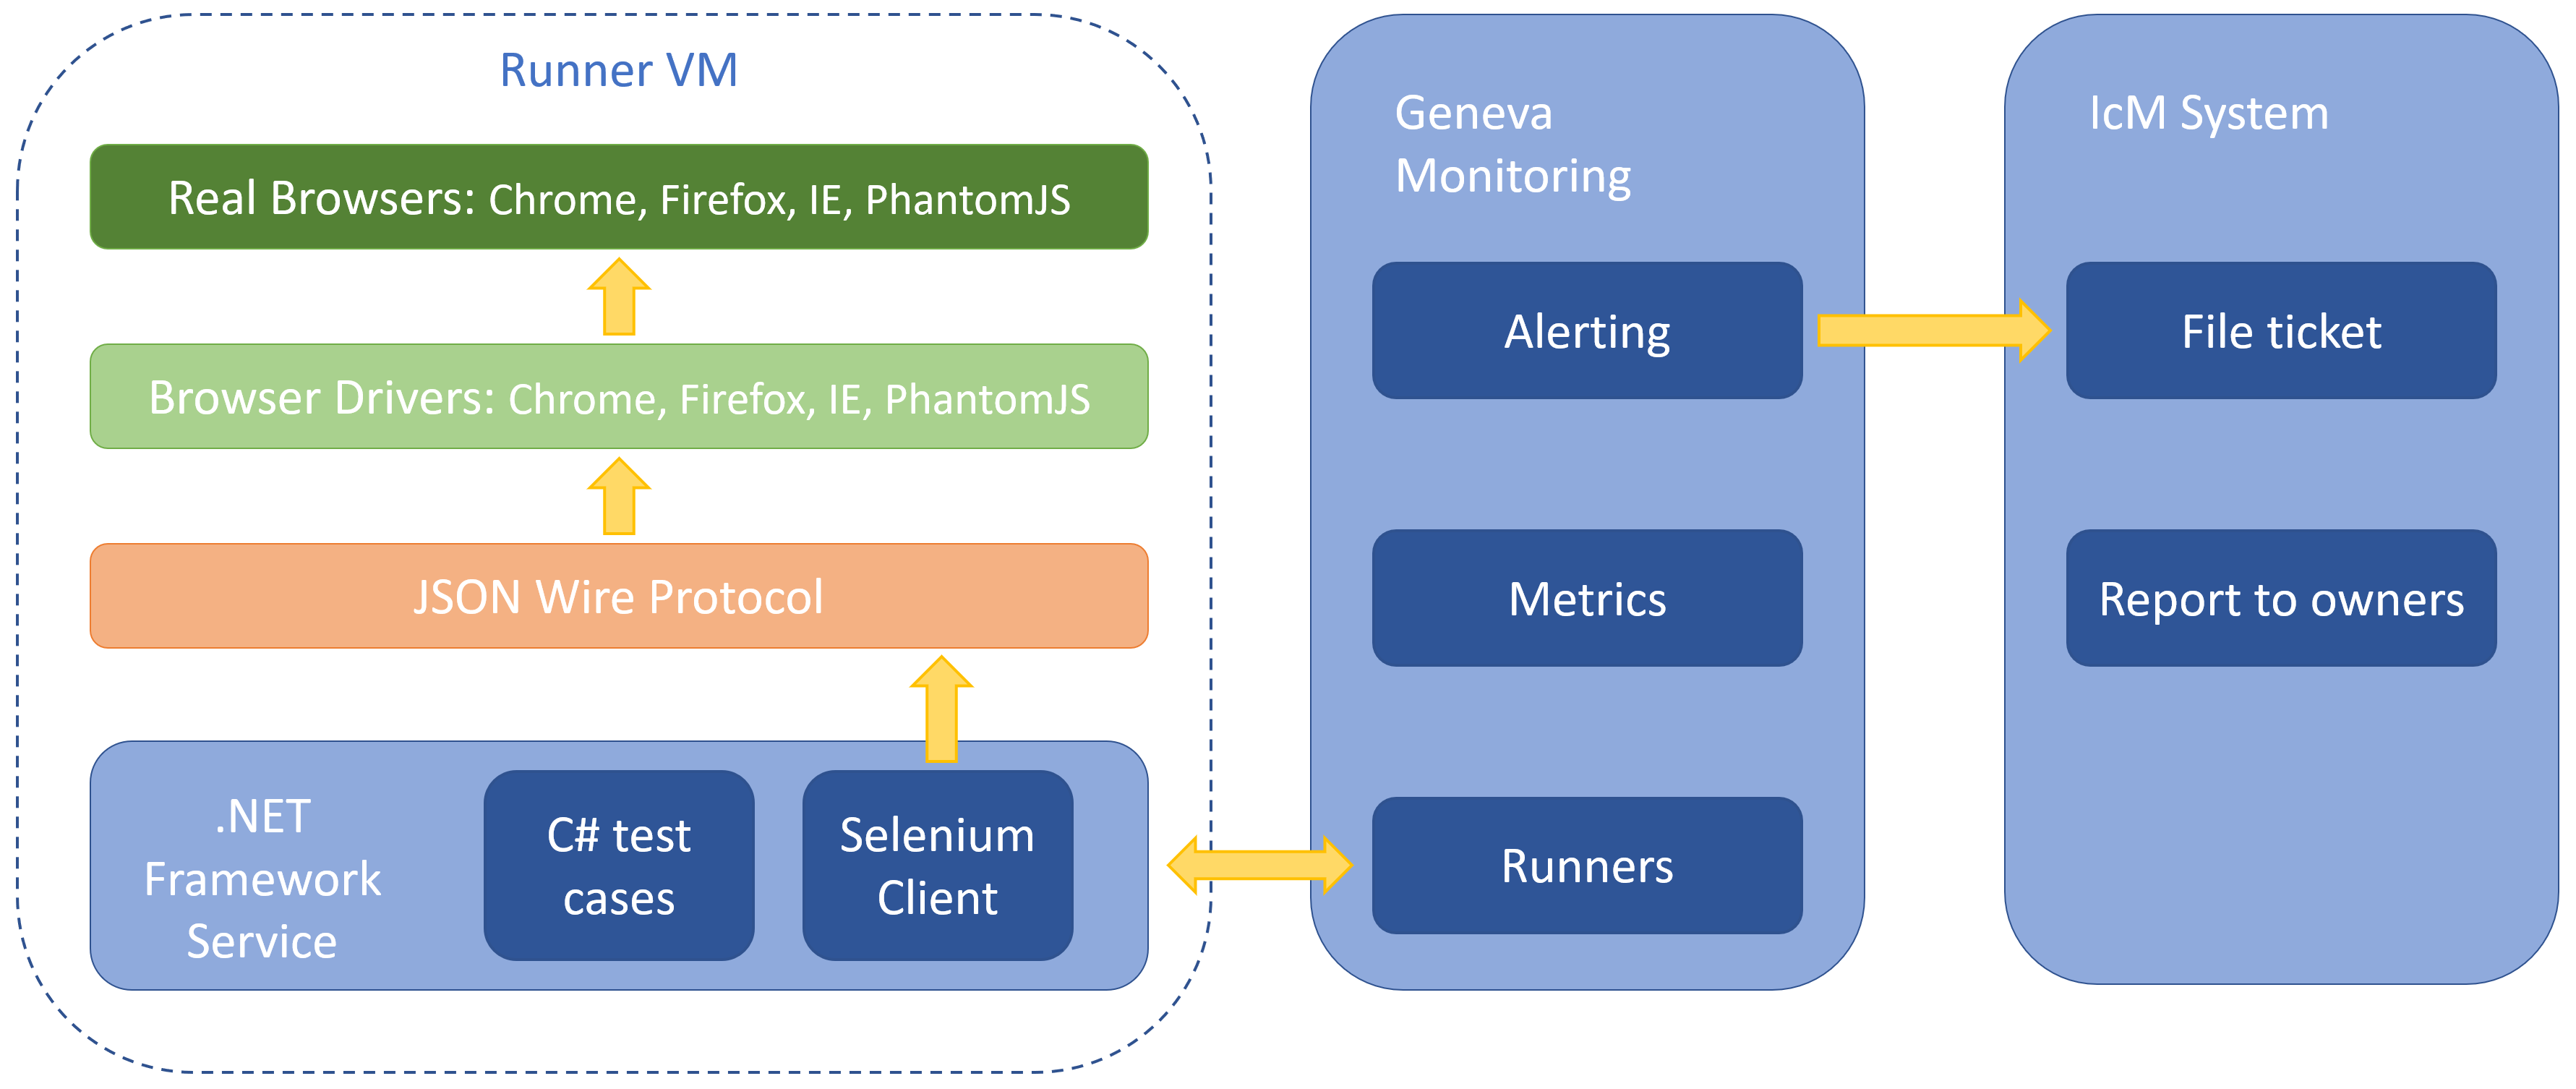
Solution for V1 is developed in about 5 years ago. Selenium is chosen as test framework, it’s usually for automating web applications for testing purpose. Test service is based on .Net framework as well as test cases coded in C# which is a very typical Microsoft style. They will manipulate Selenium client to do testing on different browsers for various scenarios by browser drivers. And the service is hosted by Geneva Runner Service, the part of Geneva Monitoring system. This system is a really useful and important internal system, Metrics and Alerting services can help for logging runner data, filing tickets in Incident Management system (IcM) and finally reporting to service owner through phone call , text message and E-mail when high priority ticket issued.
Here are the thoughts why we deprecated this solution:
- Most of us are web FE developers, it needs efforts to learn C# stuffs and write new E2E tests.
- Documents are incomplete, hard to set up and deploy, and we also don’t know the details about how it works with Geneva system.
- Tests can’t work for Chrome/IE/Firefox since 2016 Spring due to browser drivers were out of date, needing effort to fix it.
- Checking log on Geneva system is not so friendly.
- More technical debts concern for such an old project.
Dynatrace
Since legacy solution had been rejected, one of my teammates Yongliang surveyed another sophisticated solution named Dynatrace and created a basic run experiment test for all regions. Dynatrace is a no-code platform and can create test case easily by recording user operations on the target website after installing its Chrome extension. It’s also easy to integrate with IcM system due to a custom Dynatrace service already exists internally.
Sounds perfect right? But nothing is perfect. The same test in just one region couldn’t pass while in other regions were ok, layout and DOM elements were all the same except different URLs, and of course we could pass the test manually. It took Yongliang and me 2 days to find what’s the matter, and finally we gave up 😭.
Besides the unknown reason above, I also think it’s inconvenient to customize amounts of test cases due to the visual interface, at last the auto generated CSS selectors can be improved :).
Main goals of our FE solution
Since we decided to design and implement our own solution, first of all was to make clear our main goals. To build a complete solution at least as good as the legacy one, we need to:
- Select a popular JavaScript (JS) test framework and write new tests based on it to cover main scenarios of our production.
- Set up runners to run tests periodically and save test metrics to database like Geneva Runners Service does.
- Associate our test service with IcM System to enable alerting feature, it’s best to leverage Geneva Monitoring system.
Test framework
We’re good at JS and web page things, and there are lots of popular JS E2E test frameworks, so it is no doubt to choose a test framework in JS. We would write JS script based on this test framework to automate browser: navigate to our target site, login with our test account, then do what we expect by capturing DOM elements via CSS selectors and trigger DOM events like clicking button.
We already picked Jest as unit test framework for our React components, but another teammate YC chose TestCafe for E2E test at beginning because he had bad experience in E2E stuffs with Jest before. The most fantastic feature of TestCafe is it automates browsers by injecting JS scripts instead of invoking exposed APIs from browsers like Selenium does, so this allows TestCafe to run on any browser, including on mobile devices, and have a full control over the JS execution loop.
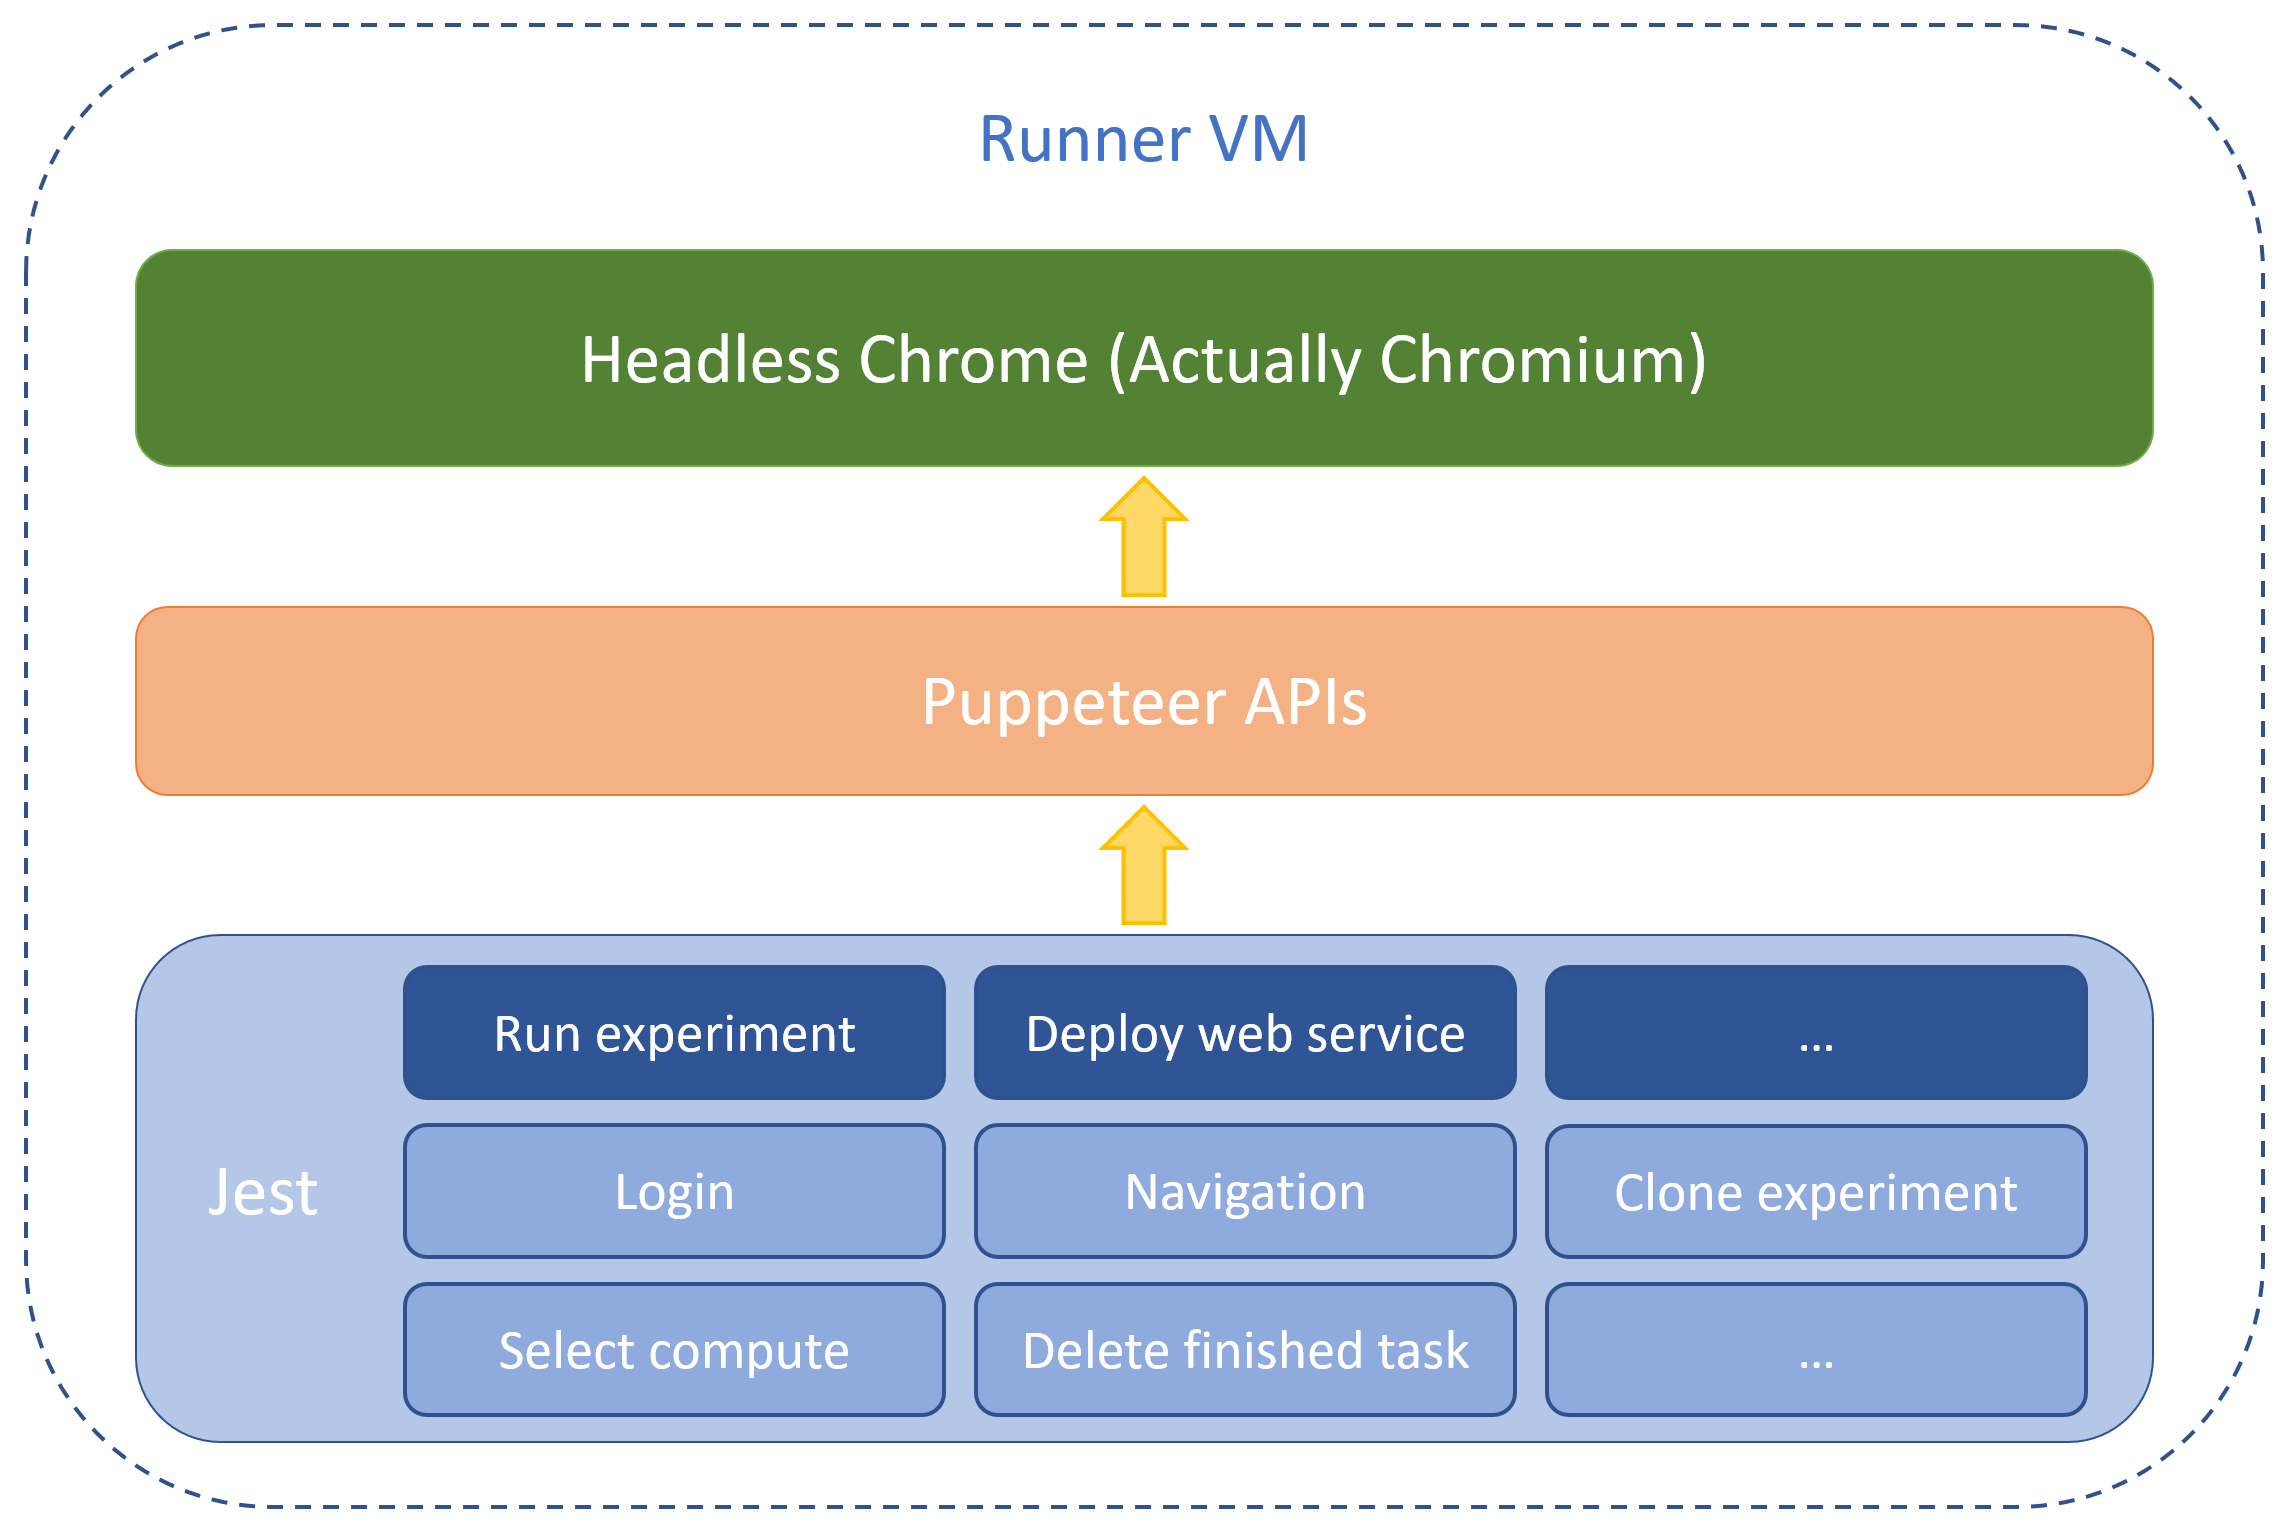
Unfortunately, after YC and I wrote some complicated test cases, we both found that tests would fail inexplicable at some steps, elements couldn’t be captured by our scripts. We didn’t have too much time to solve this problem, thus YC had to switch to Jest with Puppeteer plan quickly. Fortunately this plan was not bad, most of steps worked fine and then I wrote more test cases based on it, including common functions like login and full scenarios like run an experiment.
The biggest challenge of this part is robustness of test case scripts, which means test case can’t fail when our web application is healthy, false positive rate should be as low as possible. The unexpected failures may caused by network traffic or browser lag, we need to reorder our actions with reasonable sequence, set enough timeout and try many times to make sure test cases are stable.
Service framework: Windows Task Scheduler
I don’t have any preference on the OS of platform, there was an idle Windows server virtual machine (VM), so I started work on Windows firstly, meanwhile also applied for another Ubuntu server which I was more familiar with as backup.
Yongliang proposed to use Windows Task Scheduler to run our test cases as runner. It’s easy to set a test runner, just create a new task, add “Start a program” action as trigger with the instruction we used to type in command line to run test cases, that’s it. However, this tool is obviously not design for service, these drawbacks really annoyed me:
- Tedious configuration: can’t add multiple runner actions in one task, having to create a new task with repetitive settings for a new test case.
- Unfriendly log: too simple to see what’s happened to the runner, can’t see any log emitted by console, “History” tab and “Last Run Result” tag are really… useless.
- Not stable: sometimes runner just exited for one or two minutes, while sometimes it went well.
So we can say that Task Scheduler helped us do proof of concept (POC) quickly without any code, but it’s not design for service, we should find another plan. Before we talk about the new plan, let me introduce the metrics feature I did to make up the drawbacks mentioned above.
Metrics: Flow connectors
Metrics is a very common part in system. It’s the data source for monitoring health status of our E2E test, here we need metrics of runner status like test name, region, test result, duration and so on. Moreover, since we can’t get too much runner information from Task Scheduler, I had to log some metrics of running status to help me debug runner process.
Metrics is usally stored in database. There are two ways to communicate with database, the simple one is using client library provided by database vendor and call database APIs directly, this usually need authorization work in connection stage. For Kusto database which is also used by our production, it’s not easy to write data ingestion function (like data insertion in SQL) in Node.js due to the bad support of SDK and complicated configurations (finally I did it 😂, but we’ll talk about it later). So we had to try another way, using an authored service to forward our requests. Of course .NET framework can do this thing easily, we already did it before for client-side metrics. But I still made a quick survey and found a handy tool called Microsoft Flow.
Flow is a no-code platform that helps customers to leverage plenty of Microsoft services by corresponding connectors, including database connectors for Kusto and SQL. Simply to say, forget about authorization, just add a Kusto query connector into your flow, configure settings and query instruction for your Kusto database, lastly run your flow, then you can get your Kusto data. However Kusto doesn’t support ingestion connector, I had to applied for a new Azure SQL database resource and set a SQL insertion connector.
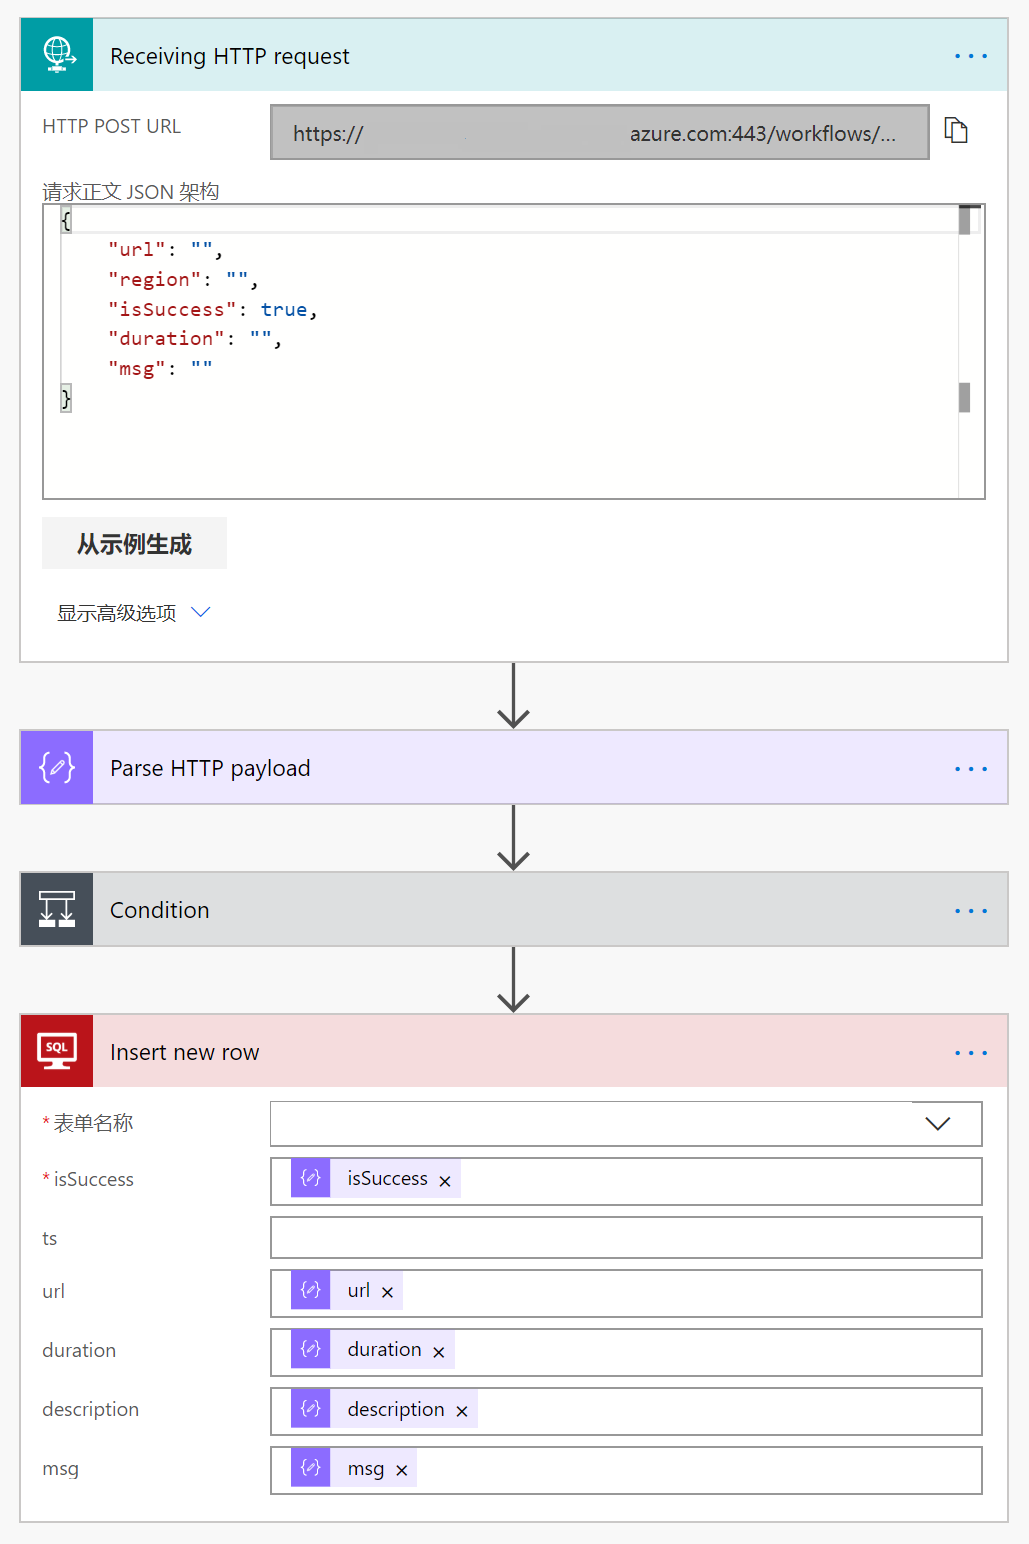
How to receive data from runner was not a hard thing too, Flow provides a set of HTTP triggers with public links as APIs, our runner will send a HTTP POST request to our trigger after finishing test work, and the trigger will collect HTTP payload which is our metrics and pass it to our SQL insertion connector.
This flow looks like the one in following picture.
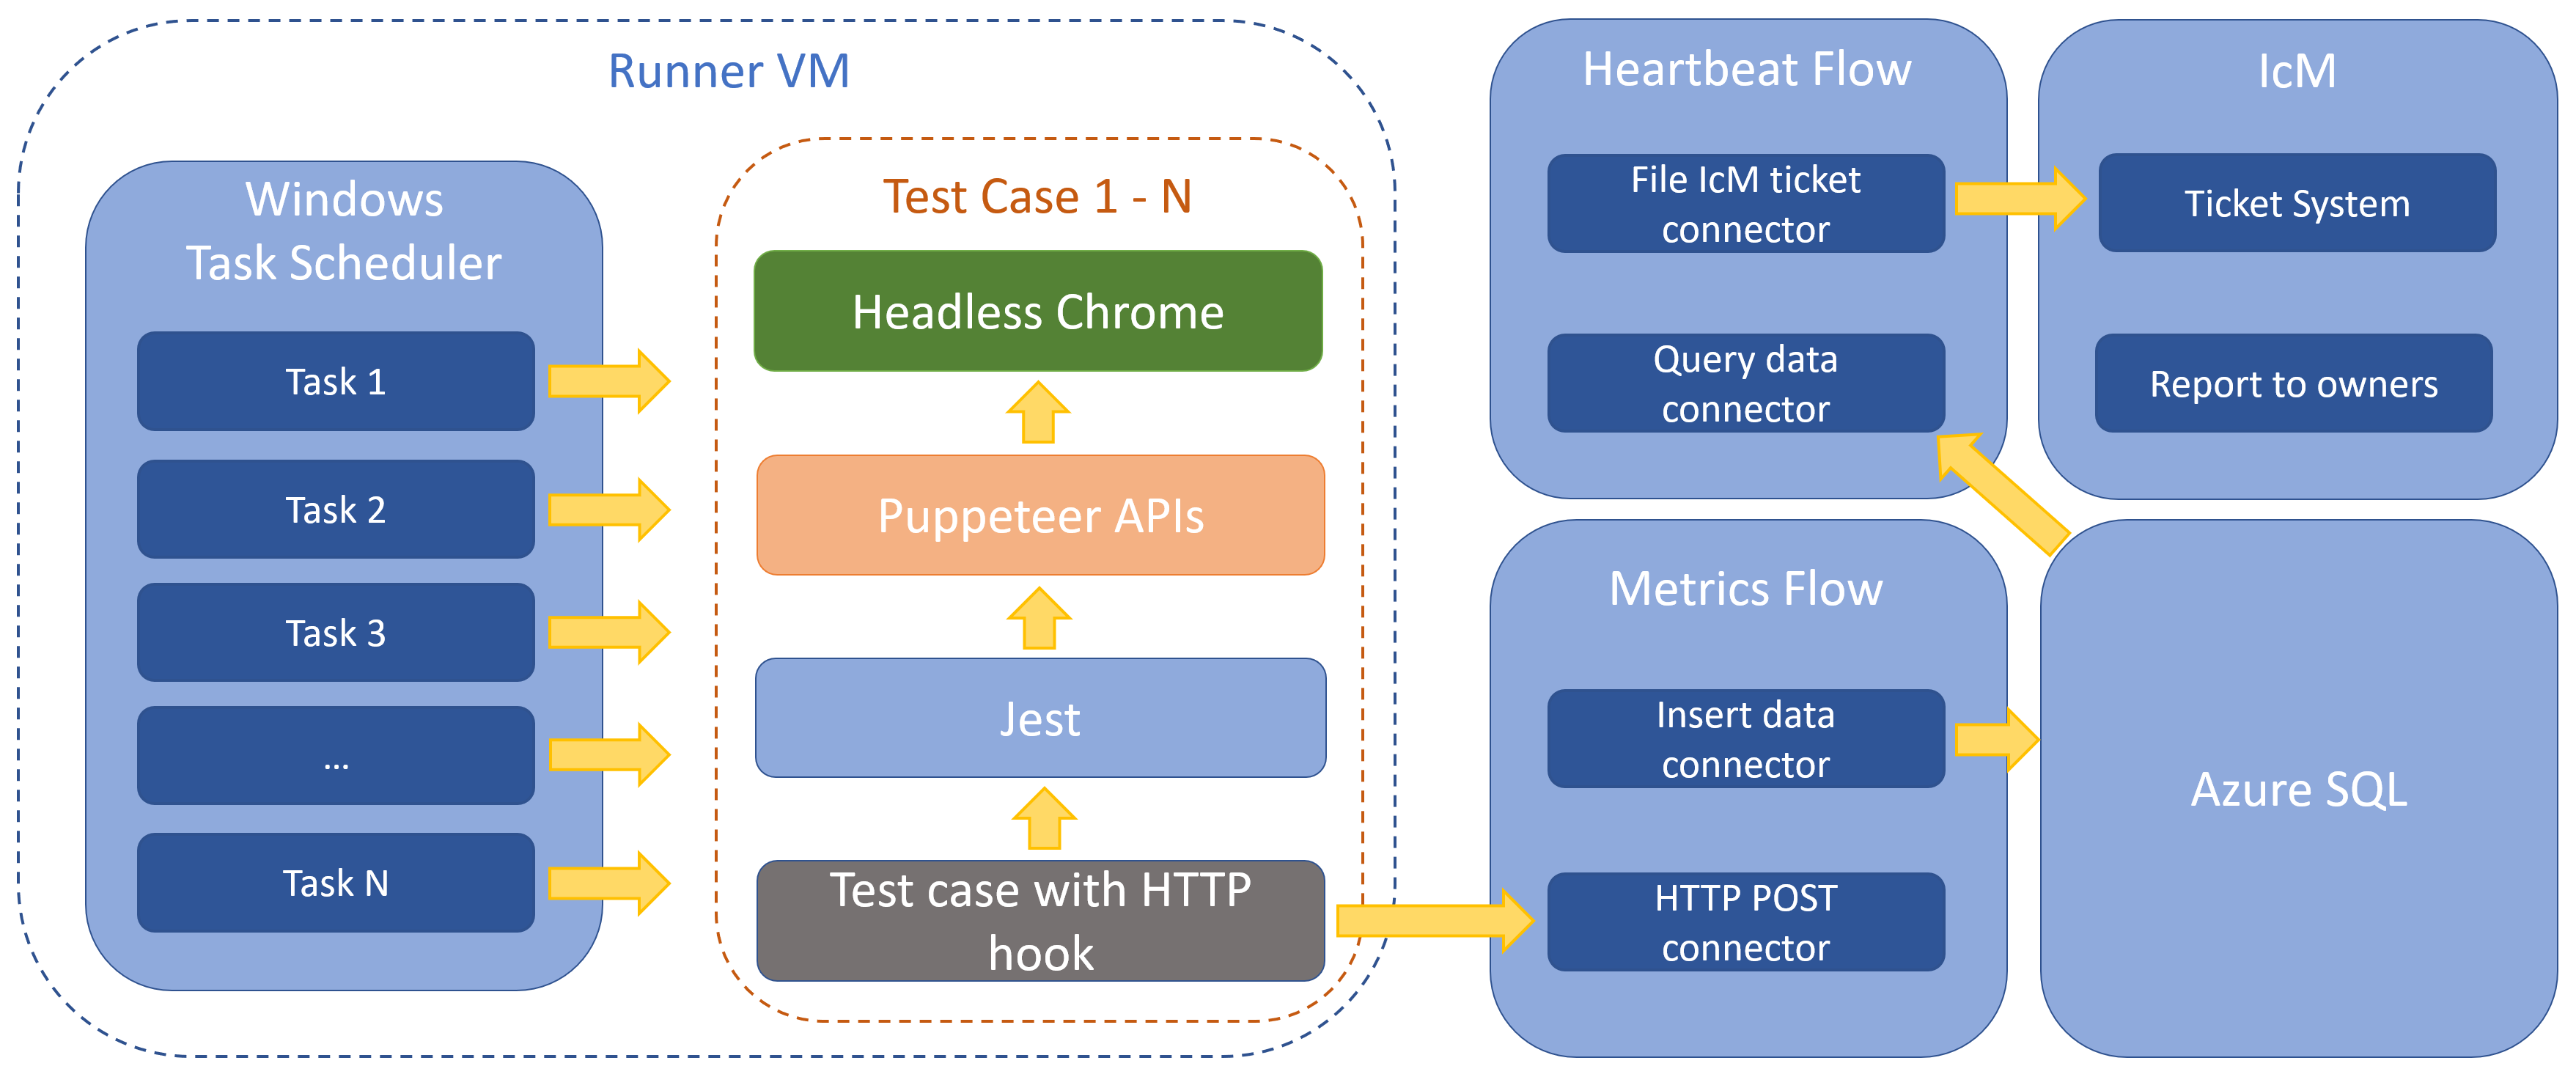
One more important thing in this section that you may think about for a while: our runners are running on a VM instead of cloud service, also Task Scheduler is not stable, how to ensure our test service is always running? Or how to keep stability of our service? If once the service stopped, how to recognize this disaster as soon as possible? A simple but useful solution is detecting heartbeat. Since we already stored metrics in database, we could query latest row and check its timestamp regularly to see if runners were still working. If time interval between latest record and current time exceeds an hour (one hour is the timeout of run experiment test), our flow will trigger IcM connector to file a ticket named like [E2E][AUE] Runners are missing heartbeat more than 60 minutes!.
We also built several dashboards for service stability which will be introduced later, at present we have simple metrics and alert, let’s take a look at following diagram to see the whole process.
Service framework: Egg.js
Although data flow has came from runners continuously and somehow went to the database and IcM system, it’s far from a real service. We would replace Task Scheduler because of its drawbacks, then optimize the rest parts of data flow.
You can’t imagine how fast JS is developing. From Express.js, KOA.js to Egg.js, server-side JS Frameworks now act more and more important role in business world. There are three reasons for me to build our service based on Egg.js:
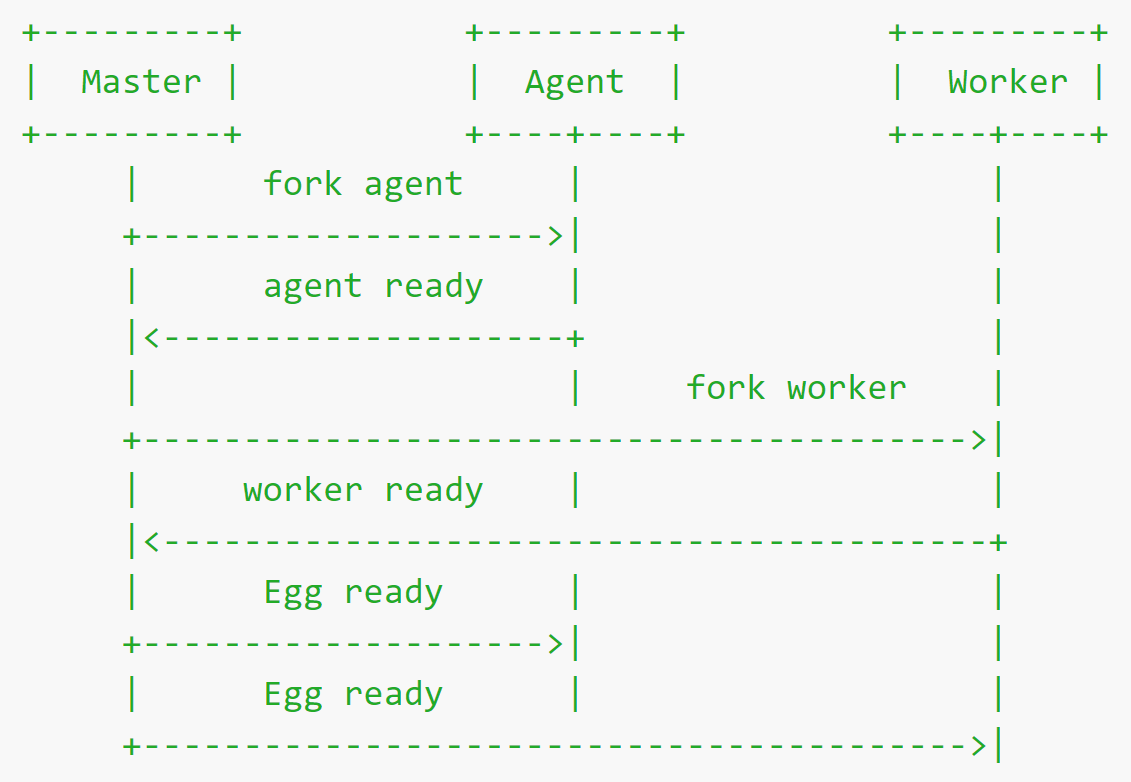
Not only I’m familiar with this framework, but it’s also an out of box framework with well documentation. Comparing with Express.js, KOA.js offers a middleware onion model to handle asynchronous operations easily, and Egg.js is based on KOA.js with more key features for building enterprise application, such as clusters and production mode.
![koa-onion-model]()
High performance with robustness, we already built several productions based on it in Alibaba for 11.11 shopping festival in last few years. Node.js service is good at I/O operations, and Egg.js offers a multi-process model to take advantage of modern CPU. We’ll talk about how it applies to our scenario soon.
![eggjs-cluster-model]()
Featured plugins like logger, scheduler, static server, i18n, session, security, template engine and so on.
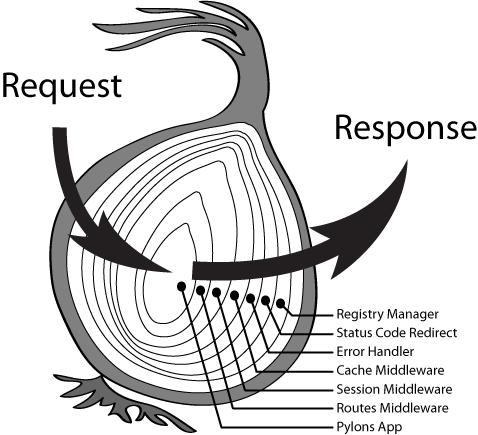
For our application, the core requirement is writing several scheduler scripts to spawn child processes for executing our test cases, framework will call schedulers by the intervals we set, and distribute the job to workers due to their workload. Egg.js has a master process as daemon process, then spawns an agent process to do common works like logging, at last creates numbers of workers (usually the number of CPU cores) to handle controller’s and scheduler’s business.
We intend to store metrics to Kusto database, then use Kusto to Geneva Metrics service so we can take advantage of Dashboard and Alerts features of Geneva Monitoring system. In current stage, I could only check results in SQL client tool. We would implement it in next chapter.
Moreover, there is a gap between runner and E2E test, only runner finished correctly and then metrics of E2E test can be stored in database, what about run-time status of runner and what if runner goes wrong? So I built a trivial dashboard (time is too precious 😔) to show basic information of runners in running or failed status within a day by React.js and Fabric UI components, hosting all resource on our service.
Metrics: Kusto Node.js SDK, Kusto to Geneva Metrics service
Based on powerful service framework, now we can migrate data insertion work from test case script to service scheduler. It will bring three benefits:
- We can leverage Dashboard and Alerts features of Geneva Monitoring system, this is the most important.
- More robustness since insertion request will not be sent if test case script exits unexpected.
- More efficiency since no more request forward needed.
There’s no doubt that it’s the first time to use Node.js with Kusto SDK in my team, but after consulting several senior colleagues, I realized it’s also the first time to use Geneva Metrics via Kusto to Metrics service. Following various documents as well as spending lots of labor work, finally whole data flow could work. It is worth to mention that official data ingestion library named “azure-kusto-ingest” had bug for a long time, I created a issue under their GitHub repo and used inline query way to bypass this problem.
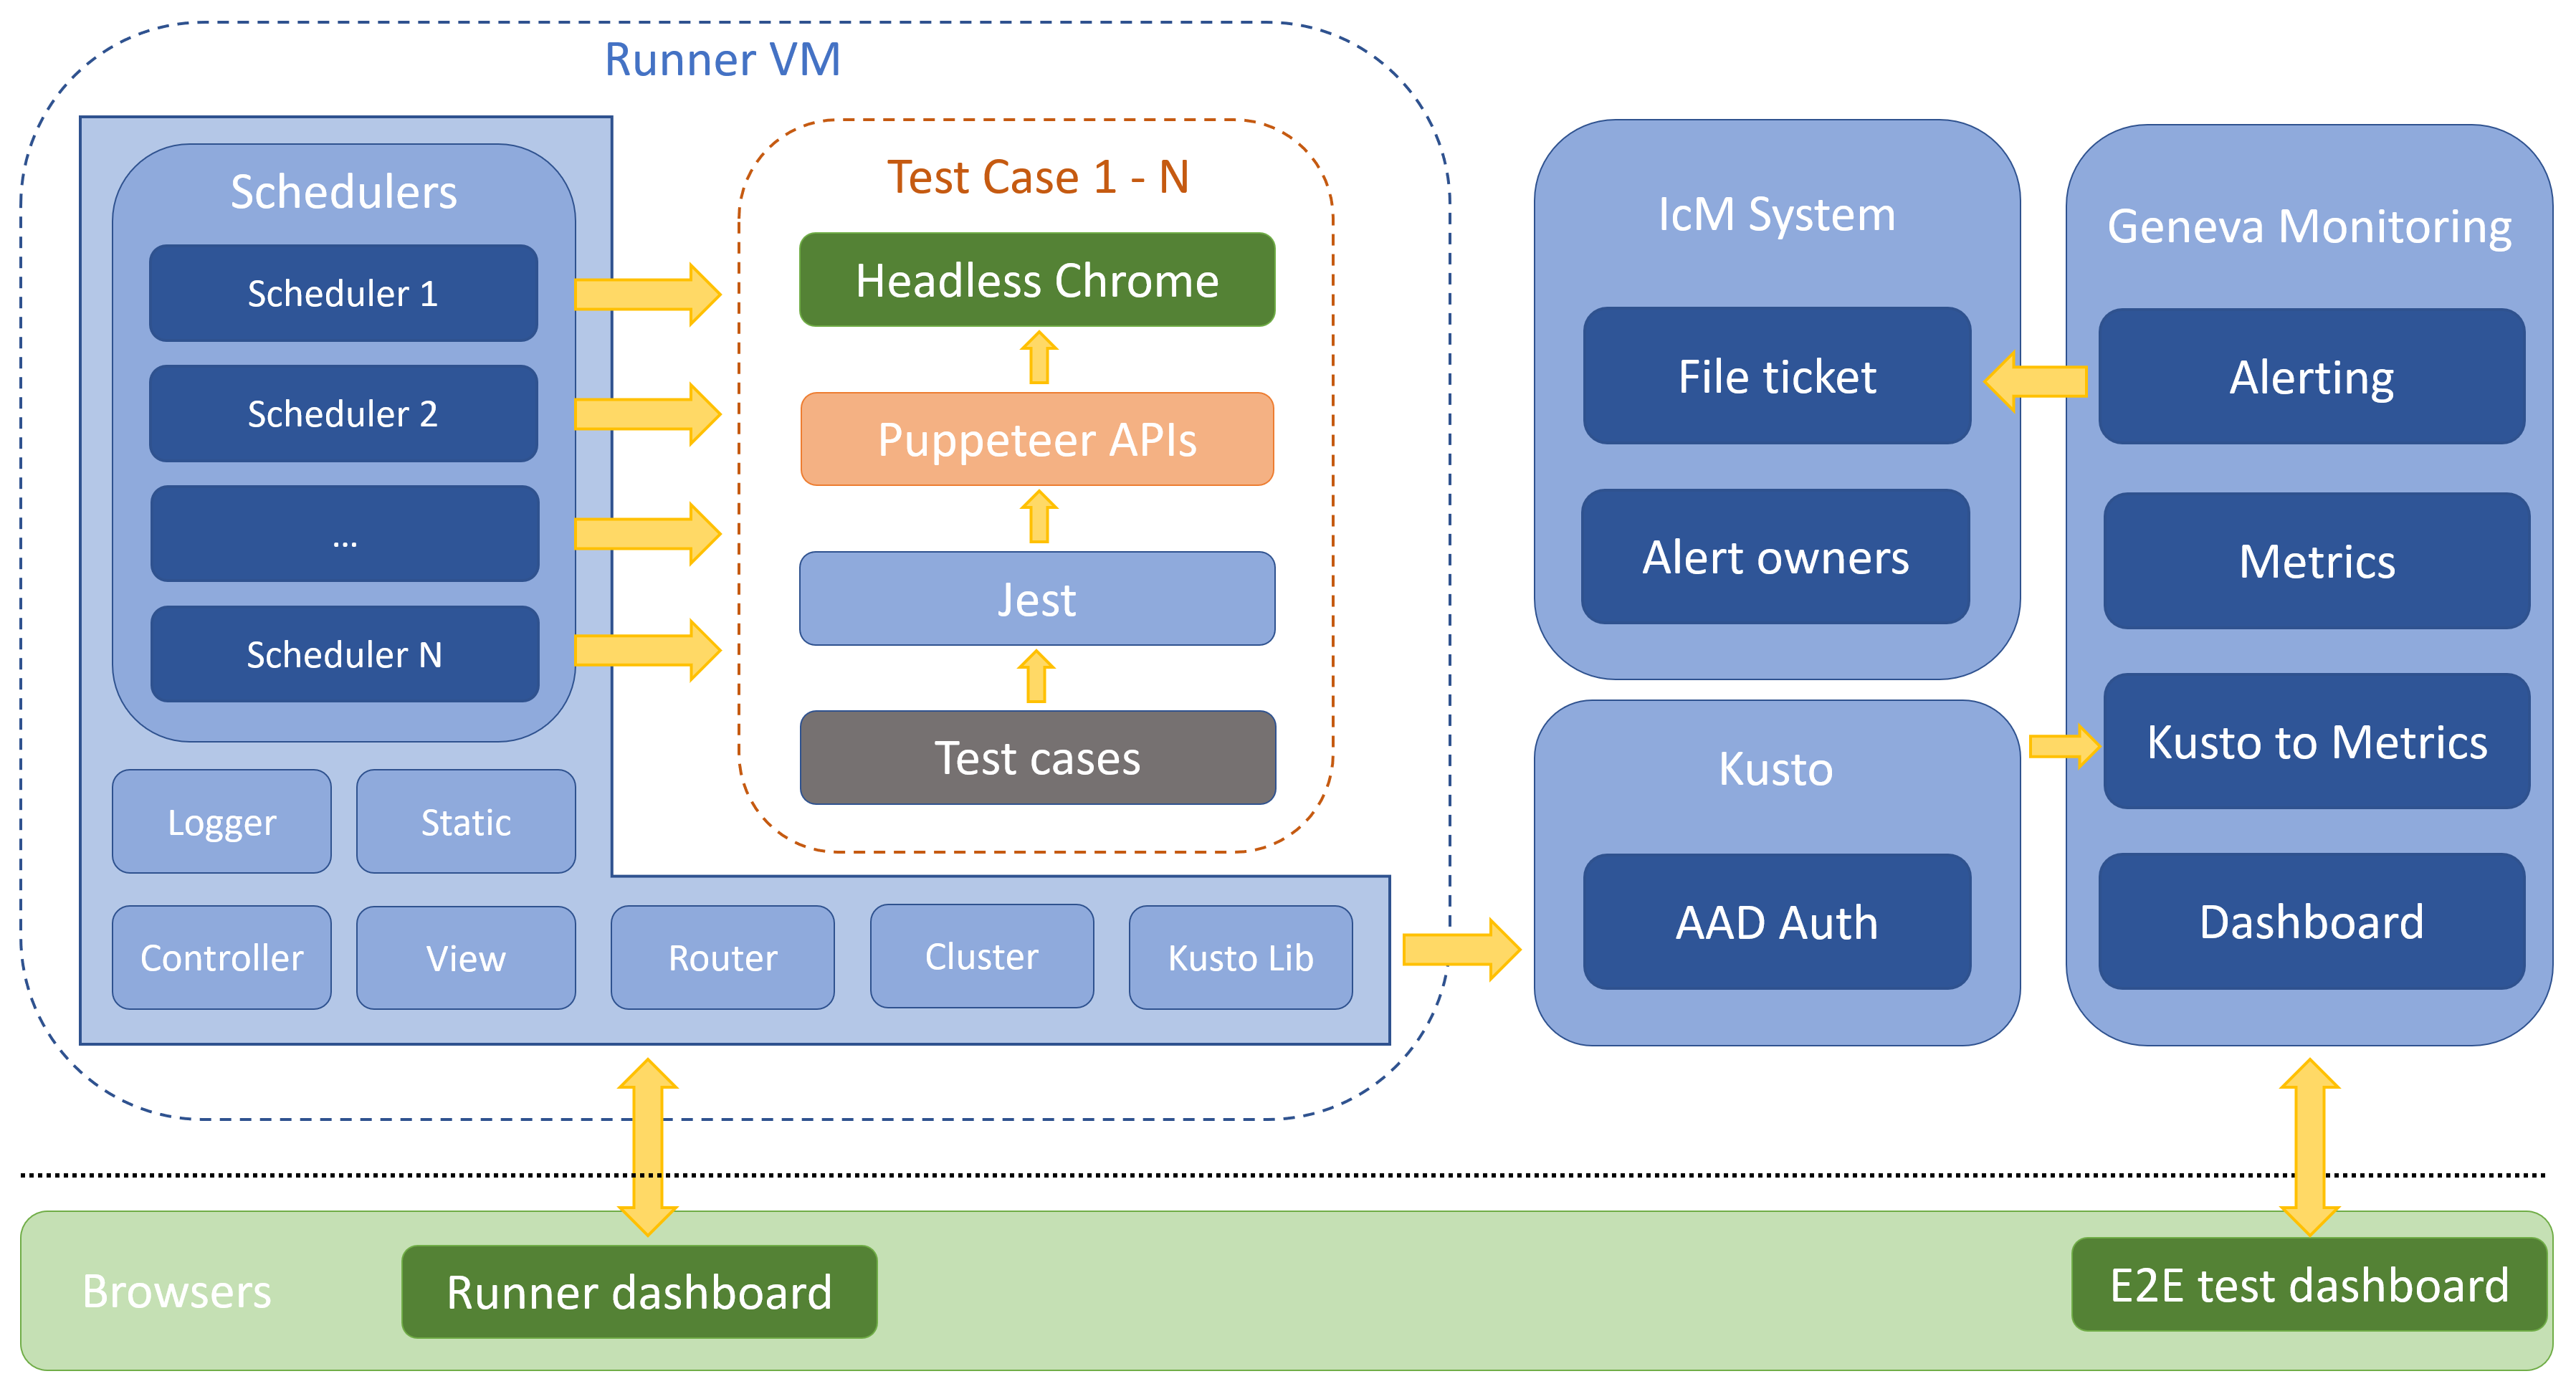
So here is our new system work flow.
Node.js can run across all popular platforms, I put service on Ubuntu server because we need to take full advantage of VM, graphical interface of Windows server is meaningless but also costs some resources. Each runner will cost about 500MB memory space (mostly taken by headless Chromium), when 30 runners work simultaneously I can’t even move the pointer on Windows server but nothing is difference on Ubuntu server through SSH connection.
You may find another “Heartbeat” flow disappeared in above diagram too, Alerting service of Geneva takes this responsibility away. We set several alerting rules for E2E test metrics, if the “real time” (actually 15 minutes delay due to Kusto to Metrics service, it’s also a crucial problem) data can’t meet one or more rules, Geneva system will file ticket automatically with preset configurations such as severity, team/owner to assign, trouble shooting guide and so on.
User case: Supporting benchmark test
While we ramp up E2E test work, a senior teammate led a benchmark test targeting at performance bottleneck of running experiments. This test needs both persistent and appropriate pressure to keep the loading of related backend service, our E2E test service is the perfect choice to trigger new experiments. Here are some highlights during this cooperation:
- Comparing with no-code solutions like Dynatrace, our test cases can be extended easily for various experiment type, regions and compute targets. Sometimes coding is faster than “clicking”.
- As we mentioned above, more than 30 runners worked well simultaneously, limitation comes from the 16GB memory. And we ever triggered more than 1000 experiments per day stably.
- Validation showed that our test results came from web page were uniform with backend service.
Looking forward
You can take first chapter “TL;DR” as conclusion, in the last chapter is about improvements from several aspects. We’ve said that this is just an “acceptable” version in the introduction, obviously lots of progress can be made, there are some thoughts in my mind:
- Deploy this system on Azure DevOps and connect to more Azure service like Azure Key Vault.
- Support other popular browsers and cover all essential scenarios.
- Enhancement of service and runner management. Providing a UI tool to empower other teammates (especially on-call guys) to manipulate E2E test, like restart specific runner, or create new runner based on configurable template.
- Better experience to debug failed E2E test. For example, our test framework can generate screenshot of failed moment, but how to management and display these screenshots need well design, and of course these can help us debug more efficient.
- Share the service to help other teams which are obsessed with E2E test. For instance they need only write custom test cases then upload to our system, no worry about runner execution, runner management and dashboard service, sounds like another Geneva but designed for E2E test.
- Leverage AI technologies to explore new test experience. Write and update test scripts are really heavy loadings, instead of repeating these boring works, can we use reinforcement learning to answer this classification problem with snapshot pictures and test result as inputs? Label snapshots is very easy, all we have to do is train a robust model.
Another E2E system built in 2021
Almost 2 years have passed, it’s such a sudden and hurried task to make a new E2E system for our classical product due to its runner service (which hosted on Geneva platform) will be decommissioned at once. Actually we have also built an E2E system based on the previous work for a Kubernetes resources management portal last year and learned a lot from it.
So what’s new in this 2021 version?
- CI/CD pipeline with Docker.
- Using Playwright as E2E testing framework.
- Saving testing results to Geneva Metrics for instant alerting and other automation actions.
- Another testing results backup including screenshots for easy and quick investigation.
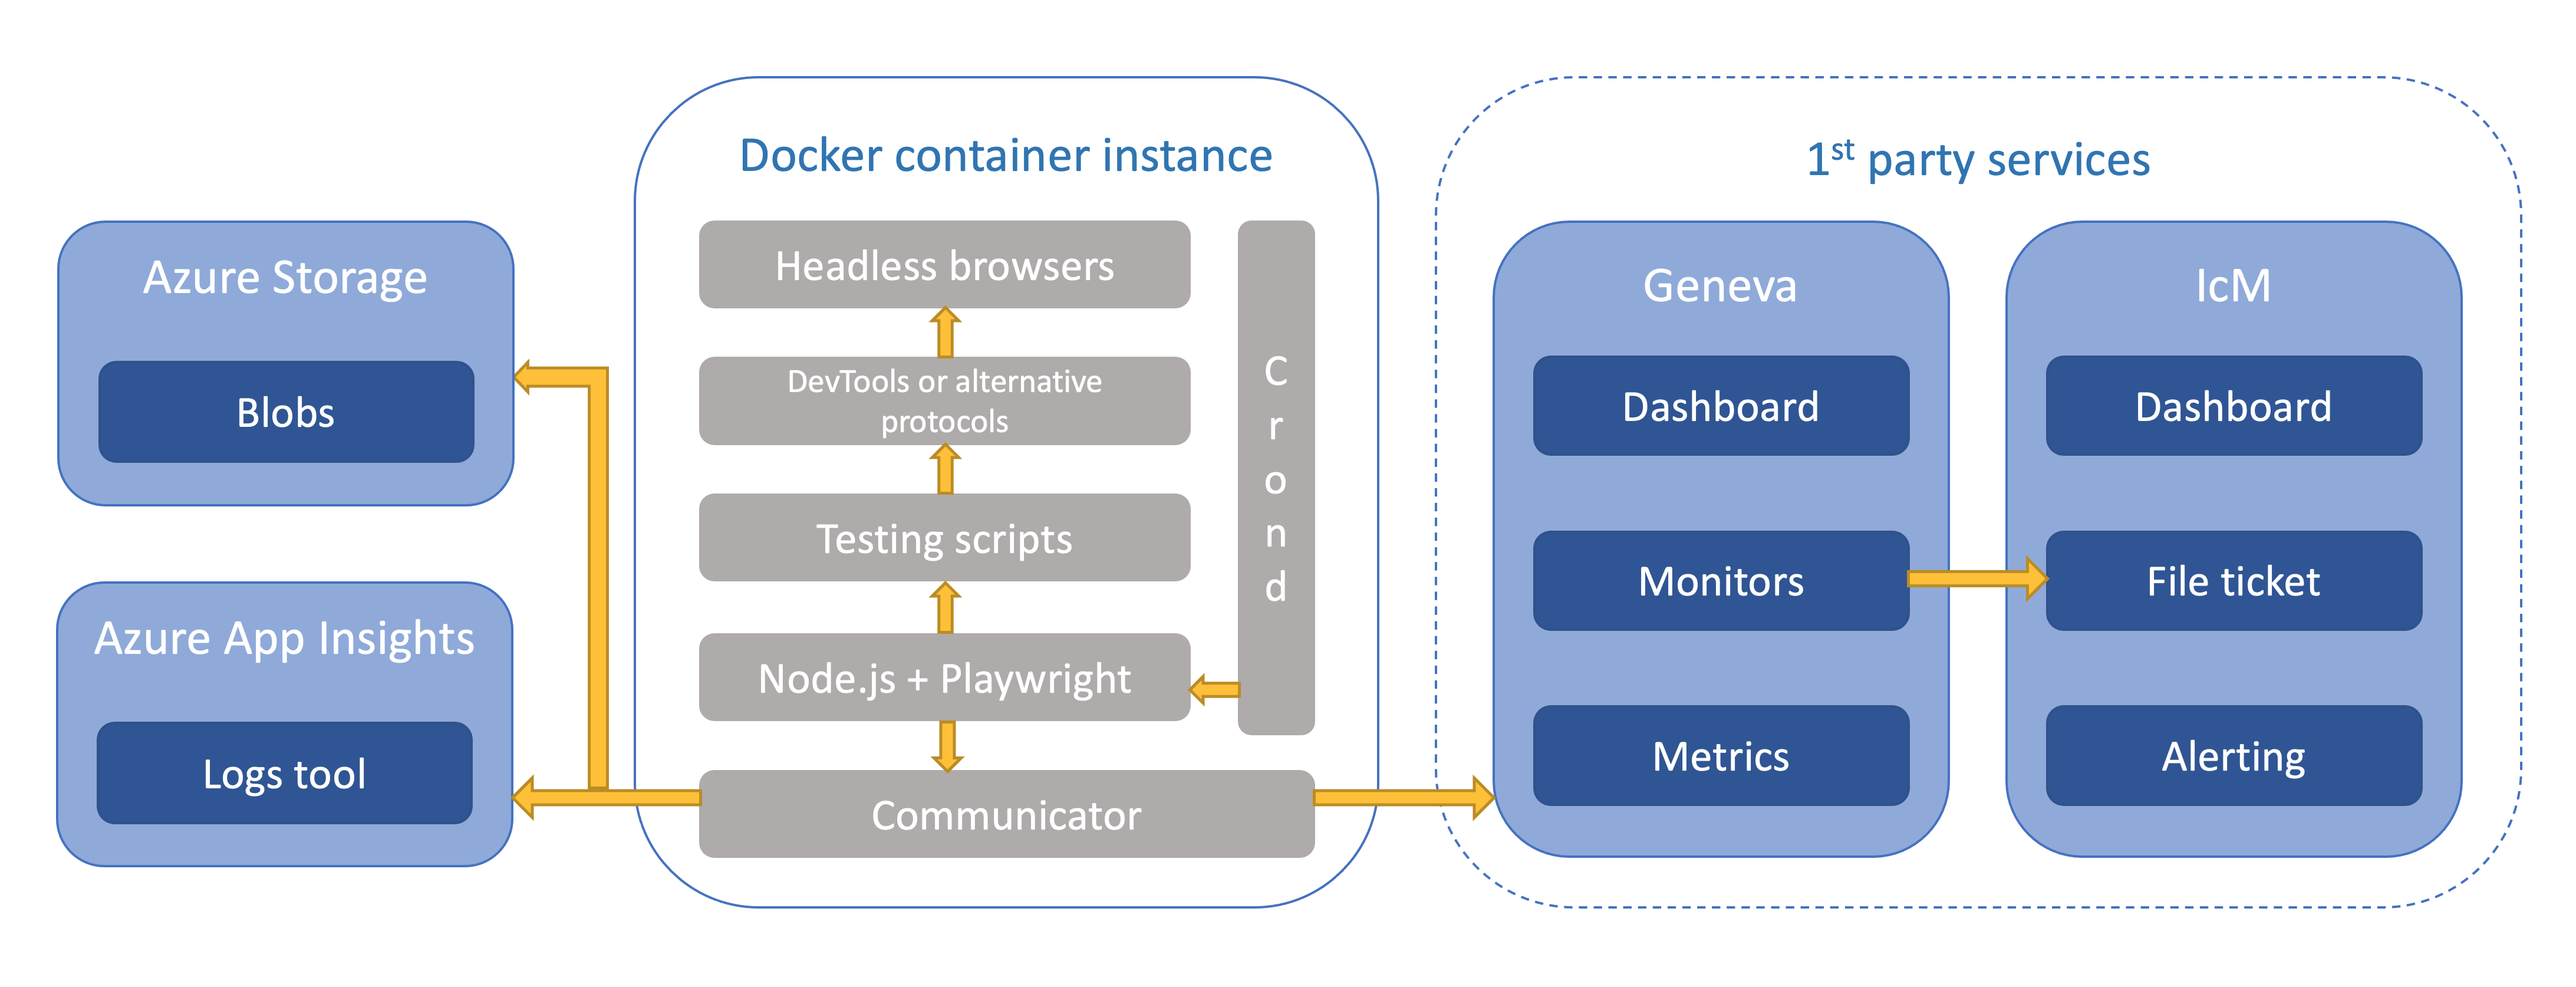
Here is the architecture of this system.
Testing framework
We choose Playwright as E2E testing framework since 2020, for its capability, reliability, compatibility and open source ecosystem. It’s easy to set up the environment by running few dependency installation commands, and there is no much difference to develop and execute test cases between Windows, macOS or Ubuntu. Though we only do our tests on headless Chromium due to time limit, Playwright can test across all modern browsers (Chromium, Firefox and Webkit) by single API.
Test cases are all written by my colleague Jie since it’s decoupled with infrastructure works. One of the difficult thing is to simulate drag and drop action to put the modules on the canvas and connect them, all based on coordinate position. We also need to pay attention to the timeout settings to improve robustness for unexpected network conditions.
CI/CD
In Microsoft, we are using Azure DevOps platform to manage our project. I build a new Azure Pipeline with an agent pool to build the Docker image and push it to our ACR (Azure Container Registry) automatically. Then just pull the latest image on an Azure VM to run/start several containers for all regions of Studio classic.
The Docker file is based on the image provided by Geneva Metrics so we can communicate with its service easily. In the Docker image build stage, it should install all reusable dependencies (like nodejs, crontab, zip, X11, …), configure the crontab task and handle certificates for Geneva Metrics. At the beginning of the Docker container, we set as entrypoint, it will run the cron deamon service and run Geneva Metrics extension foreground to keep container always running.
The Studio classic is still serving our customers across 6 regions, thus I write a script to start 6 containers at once with correspond environment variables, and the crond service will execute the test cases per 10 minutes. We can validate if they are working well by Geneva Dashboard as well as the Kusto logs from AppInsights (Azure Application Insights).
Another important thing is certificate. We don’t have to deploy our test service to the real production environment (which means you need to request permission before taking any action) right now but can record the test results to the Geneva Metrics due to the publicly trusted certificate. Before this, I used a self-signed certificate to finish the POC on local environment, then applied the trusted certificate signed by Microsoft OneCert platform and finally saved it to the Azure Key Vaulut. Of course no more AAD authentication needed.
Geneva Monitors
The most significant improvement compared to the 2019 system is the alerting latency since incident happened. Kusto has several minutes delay to show the latest result, with extra time consumed by Kusto to Metrics service to digest metrics data for the monitors, there is a real gap for sure! As we are leveraging Geneva Metrics now, we can check the metrics data on its dashboard after few seconds to at most 3 minutes.
Geneva Monitor will create incident ticket on IcM platform when alert conditions meet, for instance there is a heartbeat monitor showed below. We set a computed metric named Runs which is the total run times for web service creation test, the monitor will lookback on the sum of Runs in last 1 hour per 2 minutes, and create a severity 3 ticket if sum of Runs is equal to 0. The IcM platform will do the rest of alerting stuffs responding to different severities.
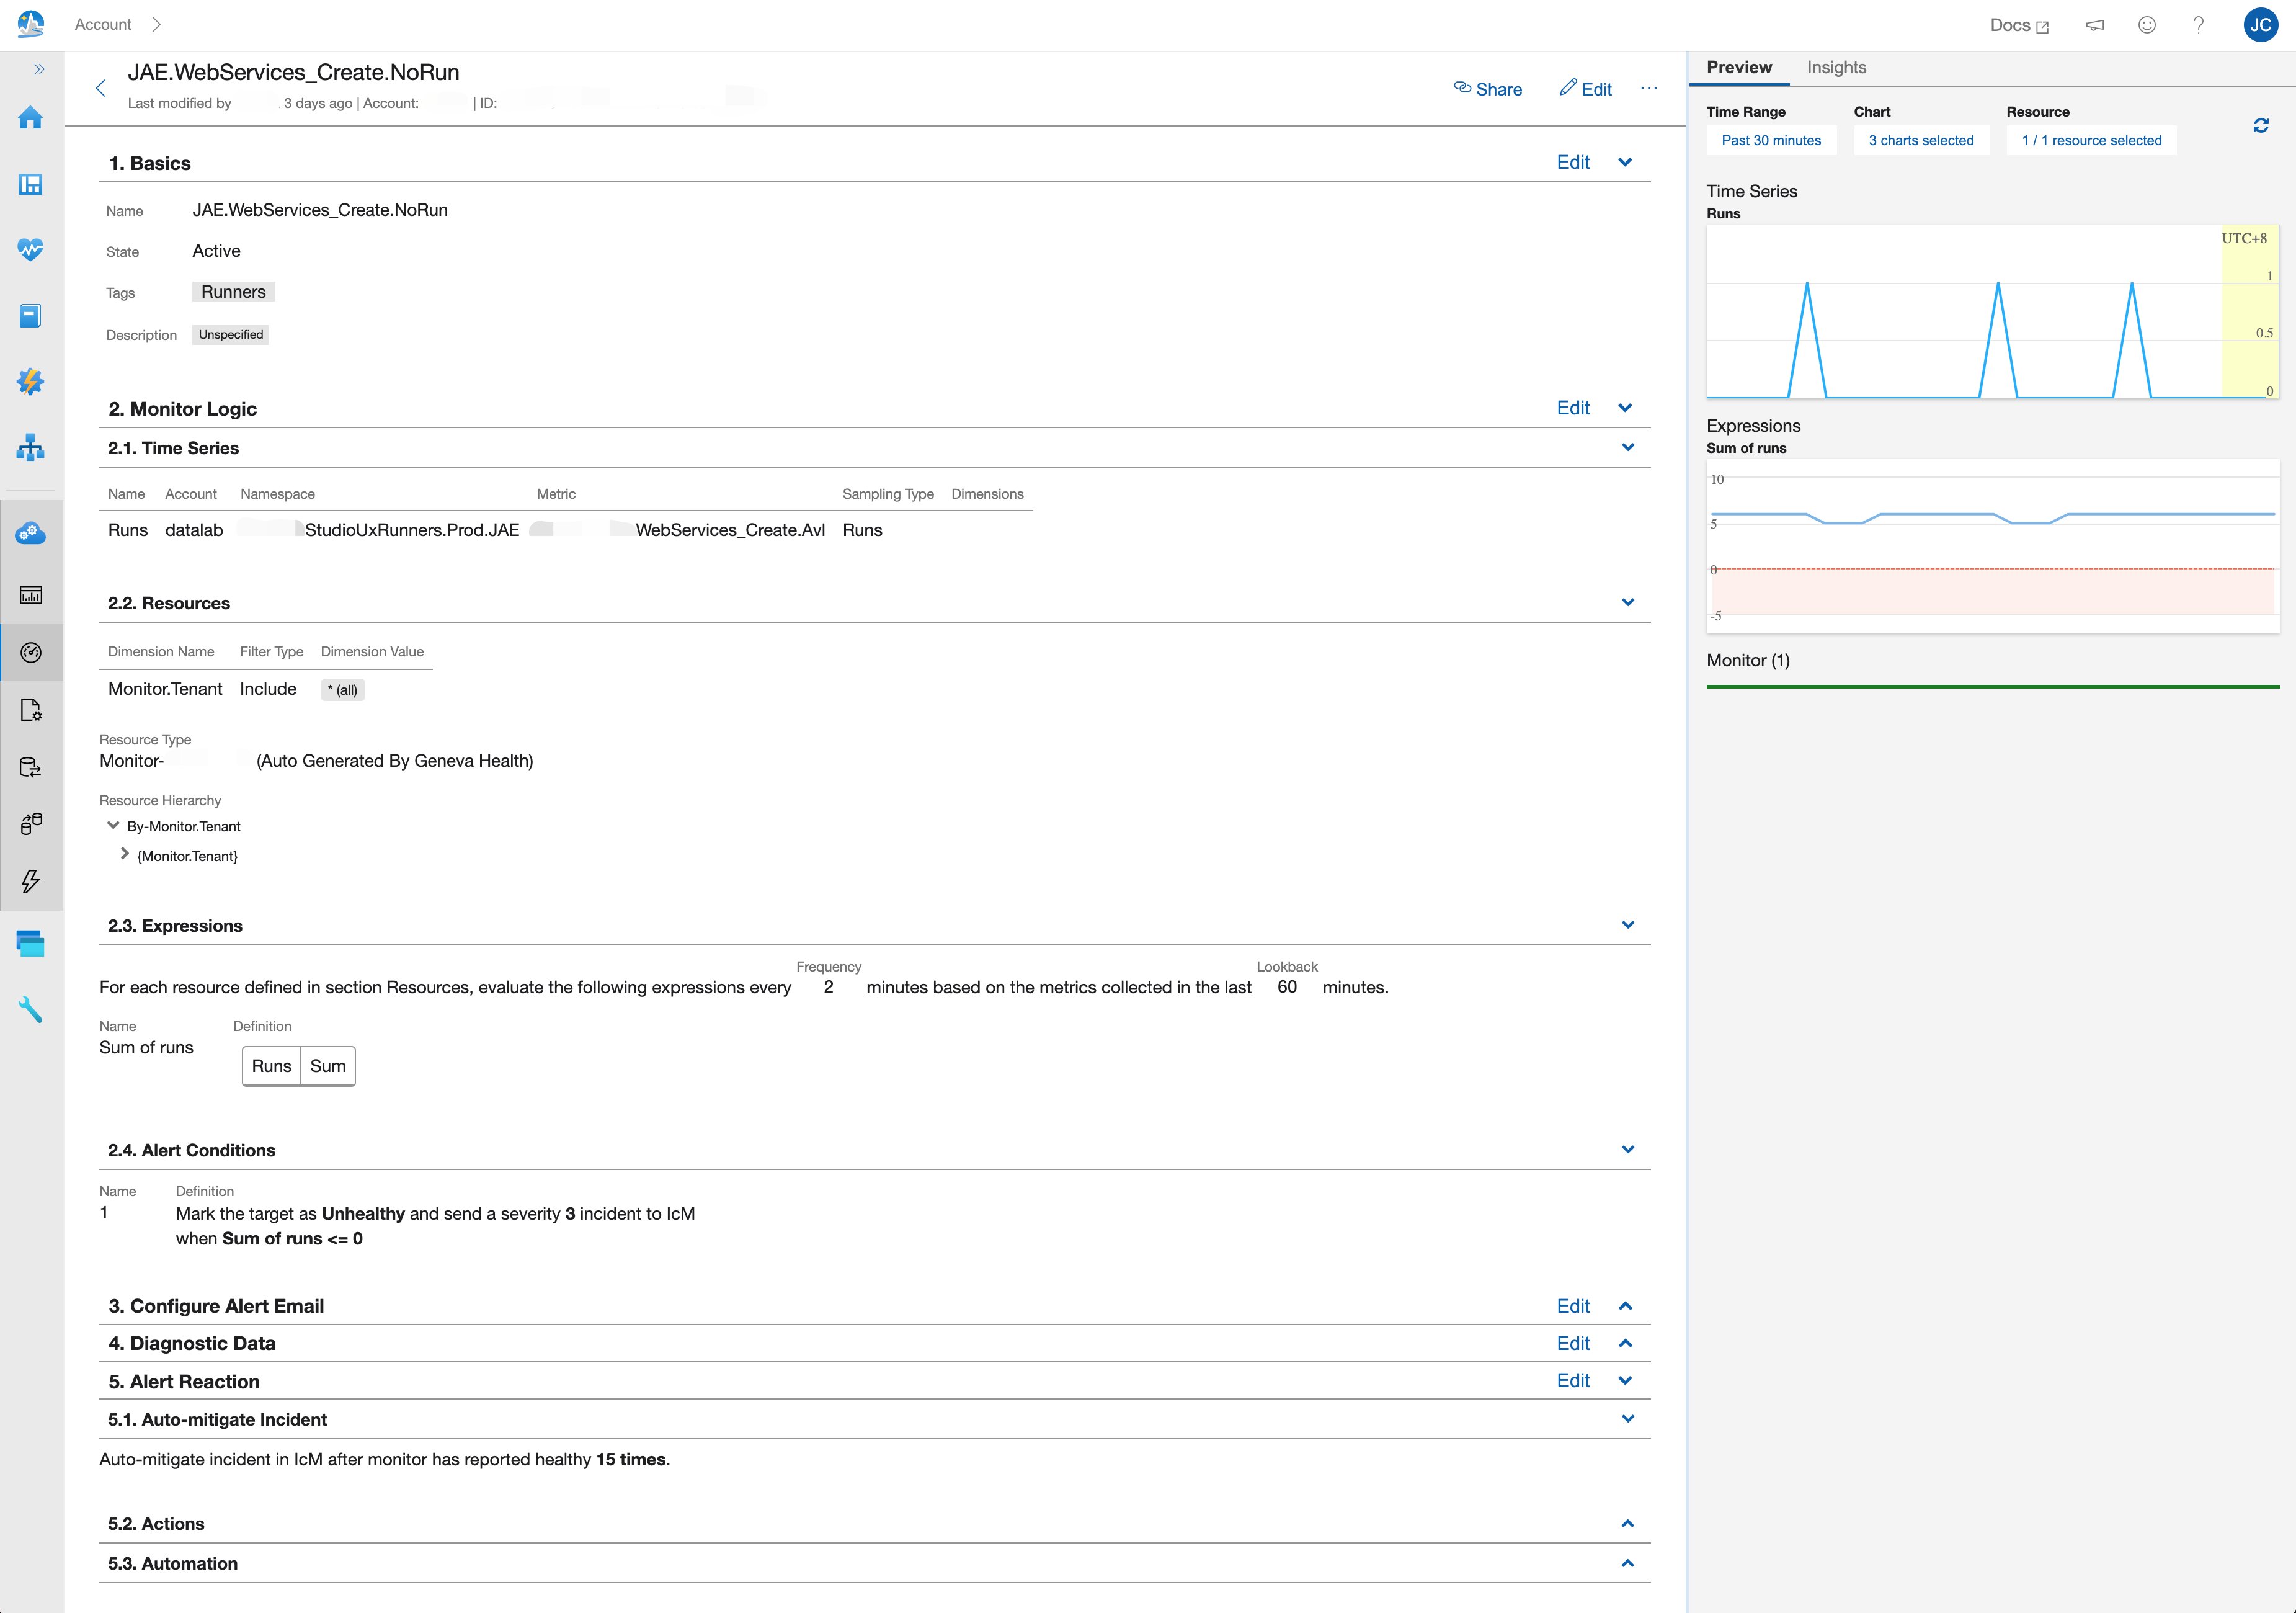
When recreated these monitors (because part of the old ones were not actually working…), I also enabled the “Auto-mitigate Incident” feature with 15 times look back. So after the incident ticket created, if the monitor status turns back to healthy for 30 minutes, it will mitigate the ticket created on IcM before. This is really helpful to the DRI (Directly Response Individual, this role is also known by various other names, such as Google’s “Sheriff” or Facebook’s slightly different “Designated Response Individual”), as I happen to be one of them.
Logs retrieve
It’s a common pain point to investigate an incident of Studio classic, the reason makes it hard for us is incomplete logs. Geneva Metrics only records whether the test result is successful or failed, and the legacy test service deployed to Geneva Runners emits too many verbose logs (like service logs) without any screenshot. In the new system, we save the screenshots of failed test cases, test report as well as the detailed logs file, upload them to the Azure Storage, record the zip link with test results to the Kusto by AppInsights service in the end. The implementation was done by my colleauge Zhongming before, I just reuse it smoothly.
Besides the screenshots can help us investigate the incident more easily and quickly, the test results in Kusto can also help us to double confirm the correctness of metrics data displayed on Geneva dashboards. Yes they already did.